React Native 21 - 指南:调试1(Debugging 1)
启用键盘快捷键(Enabling Keyboard Shortcuts)
React Native supports a few keyboard shortcuts in the iOS Simulator. They are described below. To enable them, open the Hardware menu, select Keyboard, and make sure that “Connect Hardware Keyboard” is checked.
在iOS模拟器中,React Native支持一组快捷键,下面会对其进行介绍。为了启用它们,打开Hardware菜单,选择Keyboard,确保“Connect Hardware Keyboard”是选中状态。
使用应用内开发者菜单(Accessing the In-App Developer Menu)
You can access the developer menu by shaking your device or by selecting “Shake Gesture” inside the Hardware menu in the iOS Simulator. You can also use the ⌘D keyboard shortcut when your app is running in the iOS Simulator, or ⌘M when running in an Android emulator.
设备摇一摇可以打开开发者菜单,或者在iOS模拟器中选择Hardware菜单下的“Shake Gesture”。也可以在iOS模拟器中使用⌘D快捷键,或者在Android模拟器中使用⌘M快捷键。
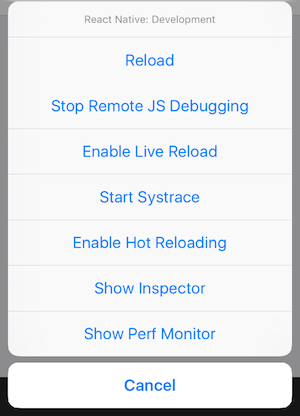
The Developer Menu is disabled in release (production) builds.
在发布(生产)构建中,开发者菜单是禁用的。
重载JavaScript(Reloading JavaScript)
Instead of recompiling your app every time you make a change, you can reload your app’s JavaScript code instantly. To do so, select “Reload” from the Developer Menu. You can also press ⌘R in the iOS Simulator, or tap R twice on Android emulators.
修改应用程序的代码之后,不用重新编译,直接重载应用程序的JavaScript代码即可立即生效。可以从开发者菜单中选择“Reload”,也可以在iOS模拟器中按⌘R快捷键,或者在Android模拟器中连按两次R。
自动重载(Automatic reloading)
You can speed up your development times by having your app reload automatically any time your code changes. Automatic reloading can be enabled by selecting “Enable Live Reload” from the Developer Menu.
代码更改后应用程序自动重载,加快开发速度。可以从开发者菜单中打开“Enable Live Reload”,以应用程序的自动重载功能。
You may even go a step further and keep your app running as new versions of your files are injected into the JavaScript bundle automatically by enabling Hot Reloading from the Developer Menu. This will allow you to persist the app’s state through reloads.
您甚至可以进一步启用开发者菜单中的Hot Reloading选项,来运行应用程序的最新版本,并保持应用程序的状态。
There are some instances where hot reloading cannot be implemented perfectly. If you run into any issues, use a full reload to reset your app.
但使用热更新并不完美,如果发现了一些不正常的问题,重载应用程序试试。
You will need to rebuild your app for changes to take effect in certain situations:
- You have added new resources to your native app’s bundle, such as an image in
Images.xcassetson iOS or theres/drawablefolder on Android. - You have modified native code (Objective-C/Swift on iOS or Java/C++ on Android).
另外在下面两种情况下,您需要重新编译应用程序:
- 当在原生应用中添加了新的资源,比如在iOS的
Images.xcassets或Android的res/drawable文件夹中添加图片。 - 当原生应用中的代码修改时(iOS中的Objective-C/Swift,或Android中的Java/C++)。
应用内错误和警告(In-app Errors and Warnings)
Errors and warnings are displayed inside your app in development builds.
在开发构建中,错误和警告信息会显示在应用程序中。
错误(Errors)
In-app errors are displayed in a full screen alert with a red background inside your app. This screen is known as a RedBox. You can use console.error() to manually trigger one.
应用程序内错误显示在红色背景的全屏弹窗中,叫做RedBox。可以使用console.error()来手工上报。
警告(Warnings)
Warnings will be displayed on screen with a yellow background. These alerts are known as YellowBoxes. Click on the alerts to show more information or to dismiss them.
警告信息会显示在黄色背景的屏幕中,叫做YellowBox。点击弹窗可以查看更多信息或者忽略。
As with a RedBox, you can use console.warn() to trigger a YellowBox.
跟RedBox类似,可以使用console.warn()来触发YellowBox。
YellowBoxes can be disabled during development by using console.disableYellowBox = true;. Specific warnings can be ignored programmatically by setting an array of prefixes that should be ignored: console.ignoredYellowBox = ['Warning: ...'];.
使用console.disableYellowBox = true;可以在开发环境禁用YellowBox。也可以设置一个前缀数组console.ignoredYellowBox = ['Warning: ...'];,通过编程的方式忽略掉某些警告。
In CI/Xcode, YellowBoxes can also be disabled by setting the IS_TESTING environment variable.
在CI/Xcode中,可以通过设置IS_TESTING环境变量来禁用YellowBox。
RedBoxes and YellowBoxes are automatically disabled in release (production) builds.
在发布(生产)构建中,会自动禁用RedBox和YellowBox。
Chrome Developer Tools
To debug the JavaScript code in Chrome, select “Debug JS Remotely” from the Developer Menu. This will open a new tab at http://localhost:8081/debugger-ui.
要在Chrome中Debug JavaScript代码,需要在开发者菜单中选择“Debug JS Remotely”,会在Chrome中打开一个新的标签页http://localhost:8081/debugger-ui。
Select Tools → Developer Tools from the Chrome Menu to open the Developer Tools. You may also access the DevTools using keyboard shortcuts (⌘⌥I on macOS, Ctrl Shift I on Windows). You may also want to enable Pause On Caught Exceptions for a better debugging experience.
在Chrome的菜单中选择Tools → Developer Tools打开Developer Tools。也可以通过快捷键(macOS中的⌘⌥I,Windows中的Ctrl Shift I)。也可以打开Pause On Caught Exceptions以获得更好的调试体验。
Note: the React Developer Tools Chrome extension does not work with React Native, but you can use its standalone version instead. Read this section to learn how.
注意:Chrome的React Developer Tools扩展不能在React Native中使用,可以使用独立版本替代。从这一节学习更多。
使用自定义的JavaScript调试器(Debugging using a custom JavaScript debugger)
To use a custom JavaScript debugger in place of Chrome Developer Tools, set the REACT_DEBUGGER environment variable to a command that will start your custom debugger. You can then select “Debug JS Remotely” from the Developer Menu to start debugging.
使用自定义JavaScript调试器替代Chrome Developer Tools,需要在启动调试器时设置REACT_DEBUGGER环境变量,然后可以在开发者菜单中选择“Debug JS Remotely”开始调试。
The debugger will receive a list of all project roots, separated by a space. For example, if you set REACT_DEBUGGER="node /path/to/launchDebugger.js --port 2345 --type ReactNative", then the command node /path/to/launchDebugger.js --port 2345 --type ReactNative /path/to/reactNative/app will be used to start your debugger.
调试器将接收到一组用空格分割的项目跟路径列表。比如,如果设置环境变量为REACT_DEBUGGER="node /path/to/launchDebugger.js --port 2345 --type ReactNative",使用列表中的node /path/to/launchDebugger.js --port 2345 --type ReactNative /path/to/reactNative/app可以打开调试。
Custom debugger commands executed this way should be short-lived processes, and they shouldn’t produce more than 200 kilobytes of output.
用这种方式启动的自定义调试器应该是一个短时间存活的进程,而且不能处理超过200k的输出。
React开发者工具(React Developer Tools)
You can use the standalone version of React Developer Tools to debug the React component hierarchy. To use it, install the react-devtools package globally:
可以使用独立版本的React开发者工具,来调试React组件结构。首先需要全局安装react-devtools:
npm install -g react-devtools
Now run react-devtools from the terminal to launch the standalone DevTools app:
然后在命令行中执行react-devtools,来启动独立开发者工具软件:
react-devtools
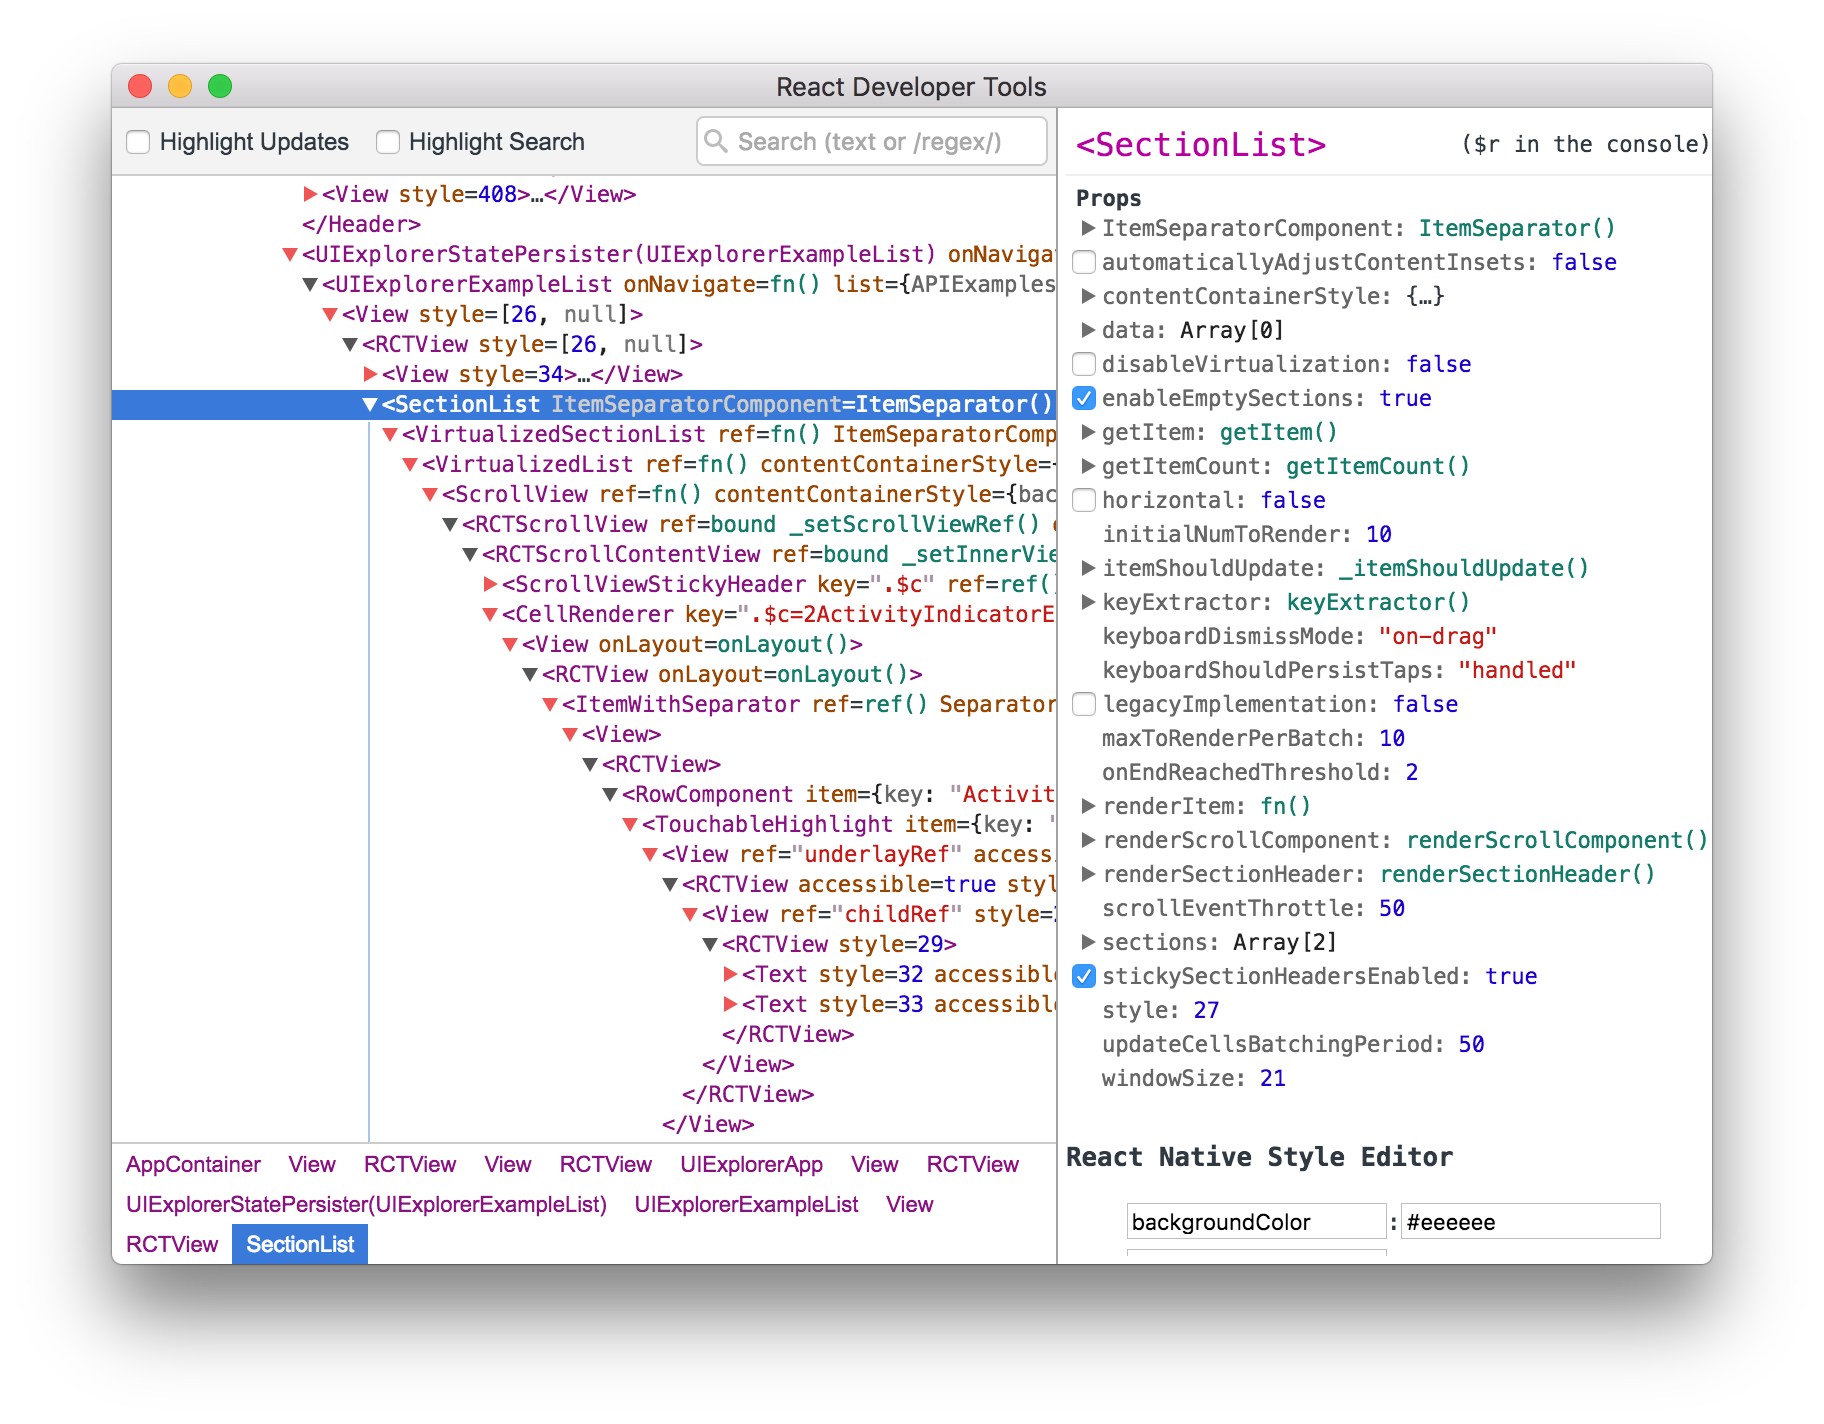
It should connect to your simulator within a few seconds.
这个软件稍后就会自动连上模拟器。
Note: if you prefer to avoid global installations, you can add
react-devtoolsas a project dependency. Add thereact-devtoolspackage to your project usingnpm install --save-dev react-devtools, then add"react-devtools": "react-devtools"to thescriptssection in yourpackage.json, and then runnpm run react-devtoolsfrom your project folder to open the DevTools.注意:如果不希望全局安装,可以将
react-devtools作为项目依赖,运行npm install --save-devr eact-devtools将其安装,然后在package.json的scripts配置中添加"react-devtools": "react-devtools",随后在当前项目文件夹执行npm run react-devtools打开开发者工具即可。
和内置的React Native查看器集成(Integration with React Native Inspector)
Open the in-app developer menu and choose “Show Inspector”. It will bring up an overlay that lets you tap on any UI element and see information about it:
打开App内置的开发者菜单,选择“Show Inspector”会打开一个调试信息蒙层,直接点击需要查看的UI元素即可。
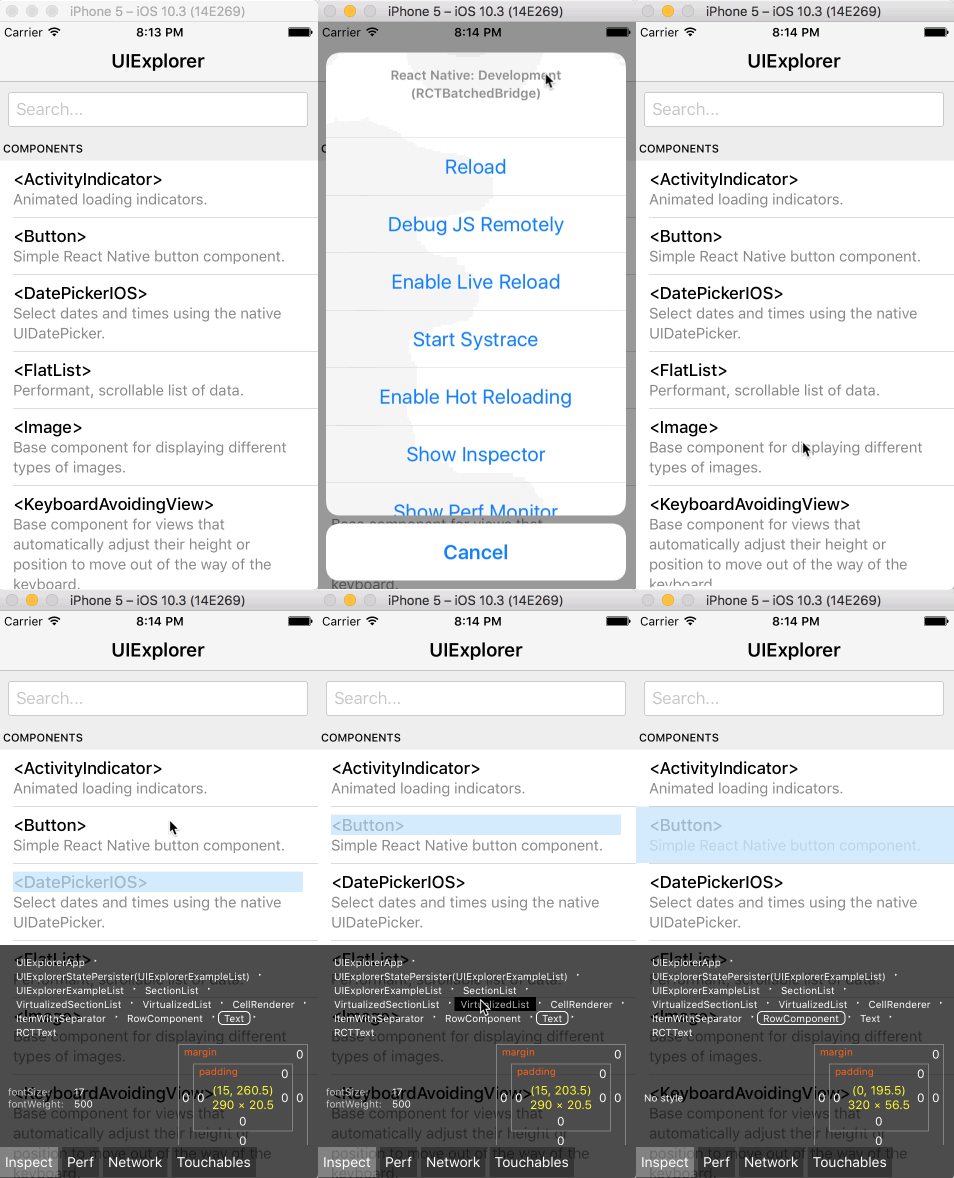
However, when react-devtools is running, Inspector will enter a special collapsed mode, and instead use the DevTools as primary UI. In this mode, clicking on something in the simulator will bring up the relevant components in the DevTools:
但是 ,当react-devtools正在运行的时候,内置查看器打开后会收起来,使用DevTools作为主界面。这时候,点击模拟器上的任何元素,DevTools会相应的响应:
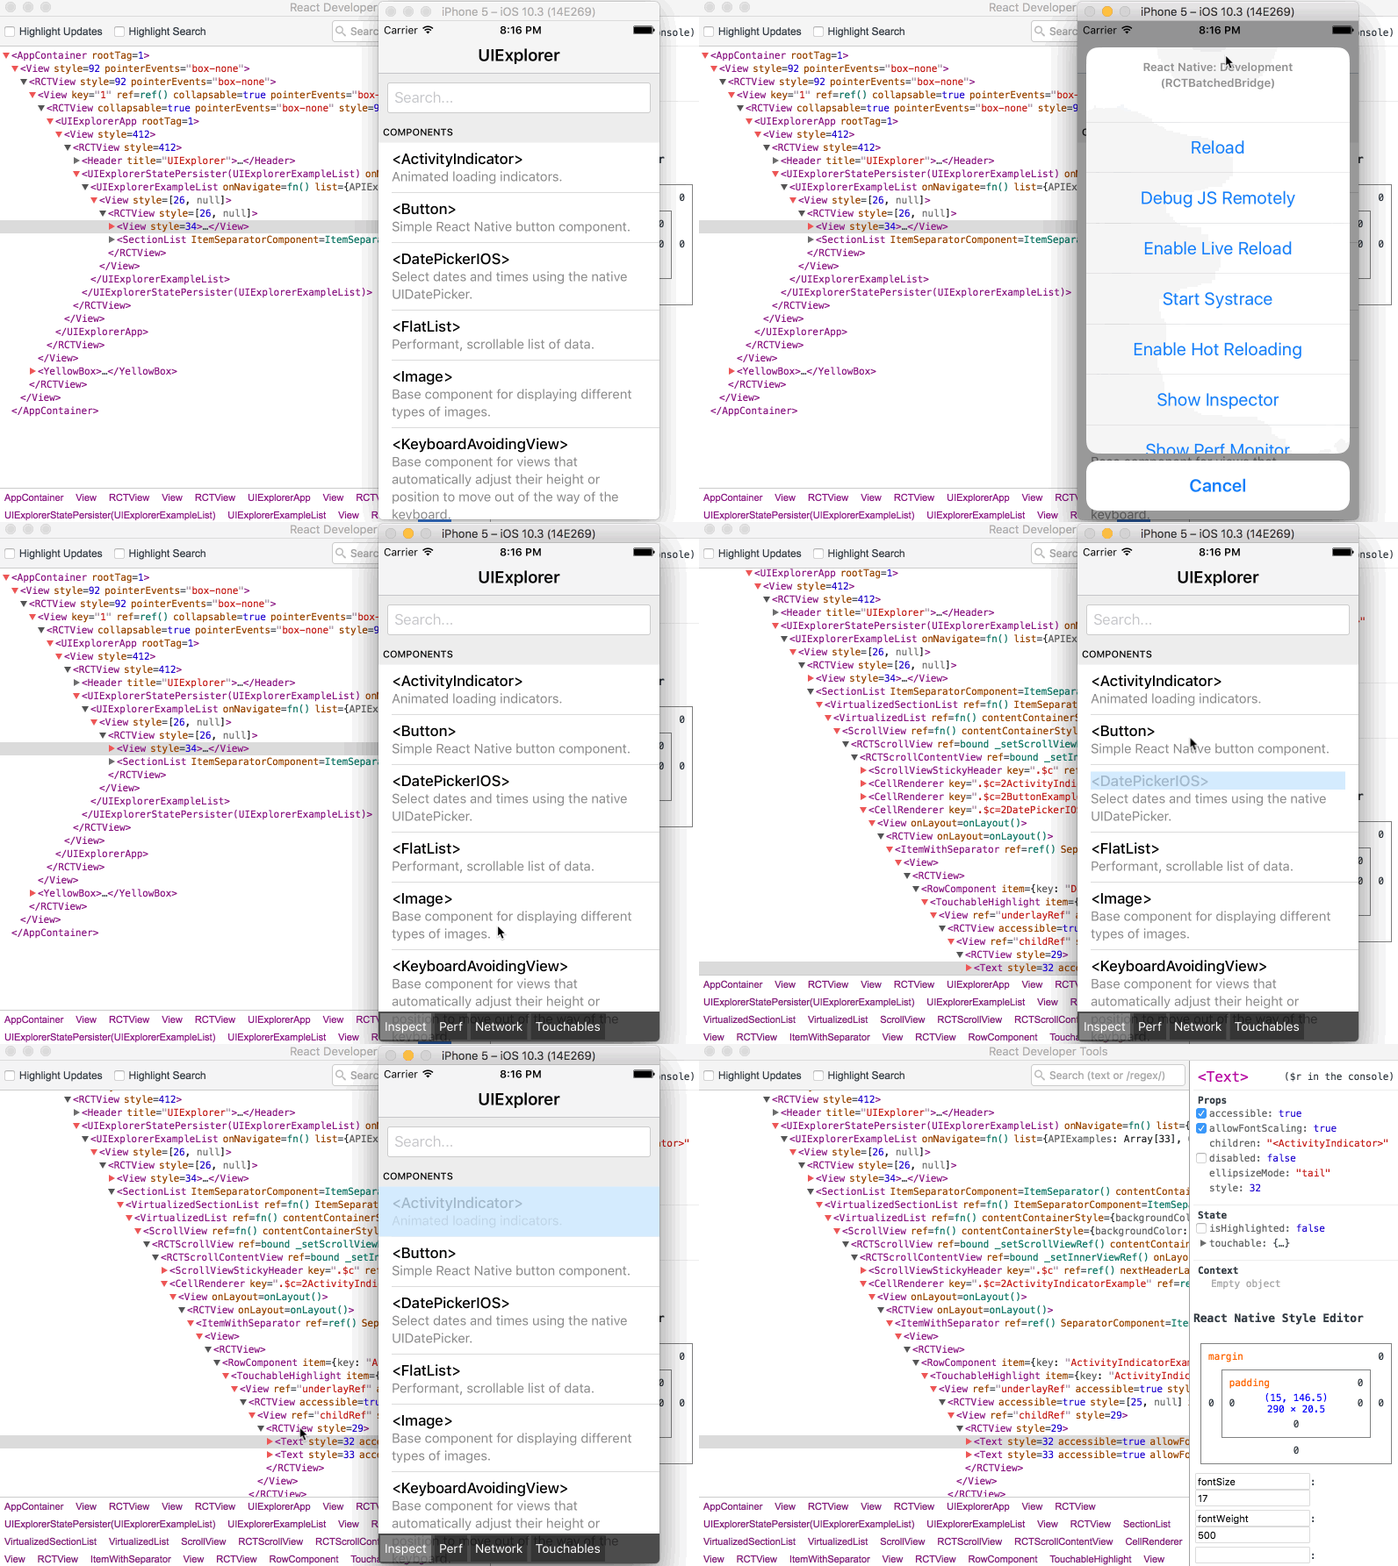
You can choose “Hide Inspector” in the same menu to exit this mode.
点击菜单中的“Hide Inspector”退出这种模式。
查看组件实例(Inspecting Component Instances)
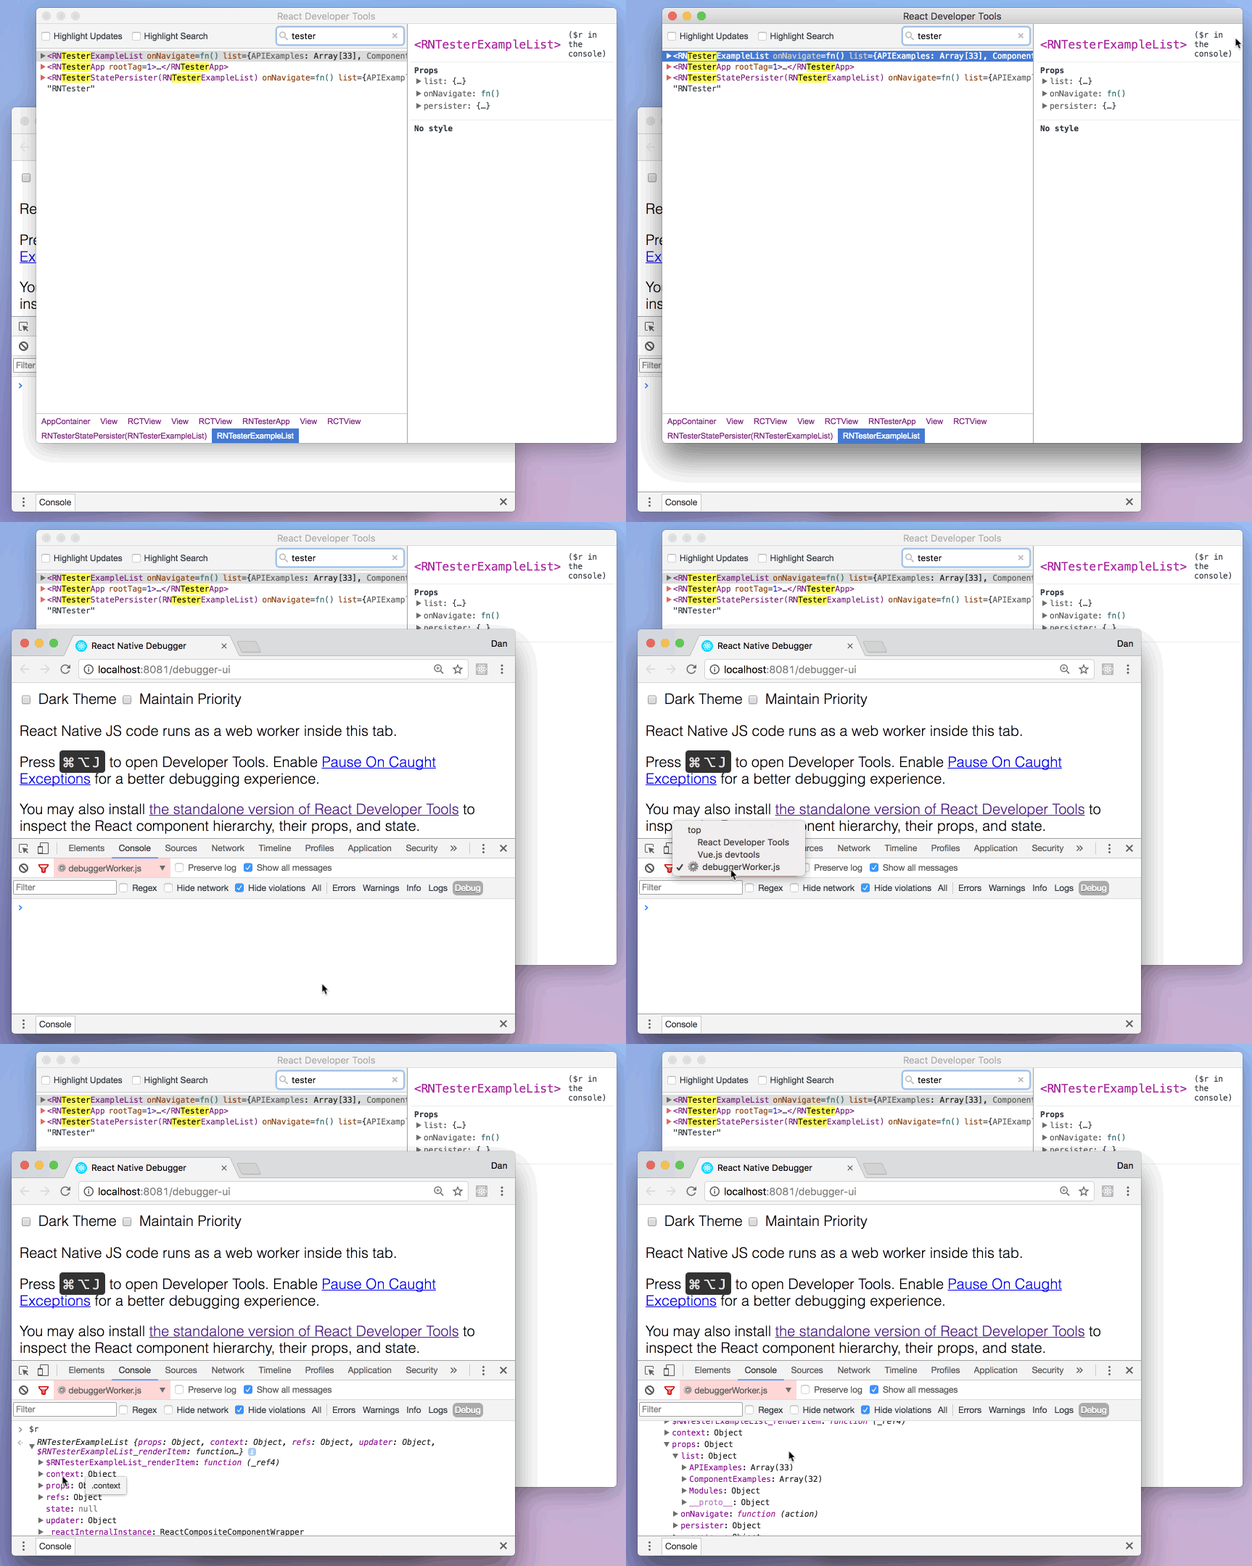
When debugging JavaScript in Chrome, you can inspect the props and state of the React components in the browser console.
在Chrome中调试JavaScript的时候,可以在浏览器的控制台中将React组件的实例打印出来,查看其属性和状态。
First, follow the instructions for debugging in Chrome to open the Chrome console.
首先,打开Chrome中的控制台。
Make sure that the dropdown in the top left corner of the Chrome console says debuggerWorker.js. This step is essential.
确保控制台在左上角的下拉菜单中选中debuggerWorker.js。这个步骤非常关键。
Then select a React component in React DevTools. There is a search box at the top that helps you find one by name. As soon as you select it, it will be available as $r in the Chrome console, letting you inspect its props, state, and instance properties.
随后在DevTool始终选择一个React组件,顶部的搜索框可以根据名字搜索组件。选中之后,在Chrome的控制台中,使用$r变量可以将其打印出来查看器Props、State和其他实例属性。
性能监视器(Performance Monitor)
You can enable a performance overlay to help you debug performance problems by selecting “Perf Monitor” in the Developer Menu.
在开发者菜单中选择“Perf Monitor”选项可以打开性能监视器蒙层,来监测性能状态。